Subscribe to Genomely for the latest discoveries and in-depth analyses in your inbox
Thank you for subscribing and for your continued support and passion for science!
Graphical abstracts are an increasingly important aspect of scientific publishing. They have helped me distill large, often multi-year projects into a singular, well-tuned message. If associated with a publication, graphical abstracts serve as the president of first impressions for potential readers.
An effective graphical abstract requires careful consideration and a balance of aesthetic appeal and scientific clarity. I know what you may think — creating a graphical abstract sounds hard. Honestly, it is; however, it is one of the most useful and rewarding exercises.
Here, I’ve attempted to guide you through the steps I’ve taken to design a professional, eye-catching, and informative graphical abstract. There may be advice here you find useful and I hope you take that with you. There may be advice here you don’t agree with; leave that behind.
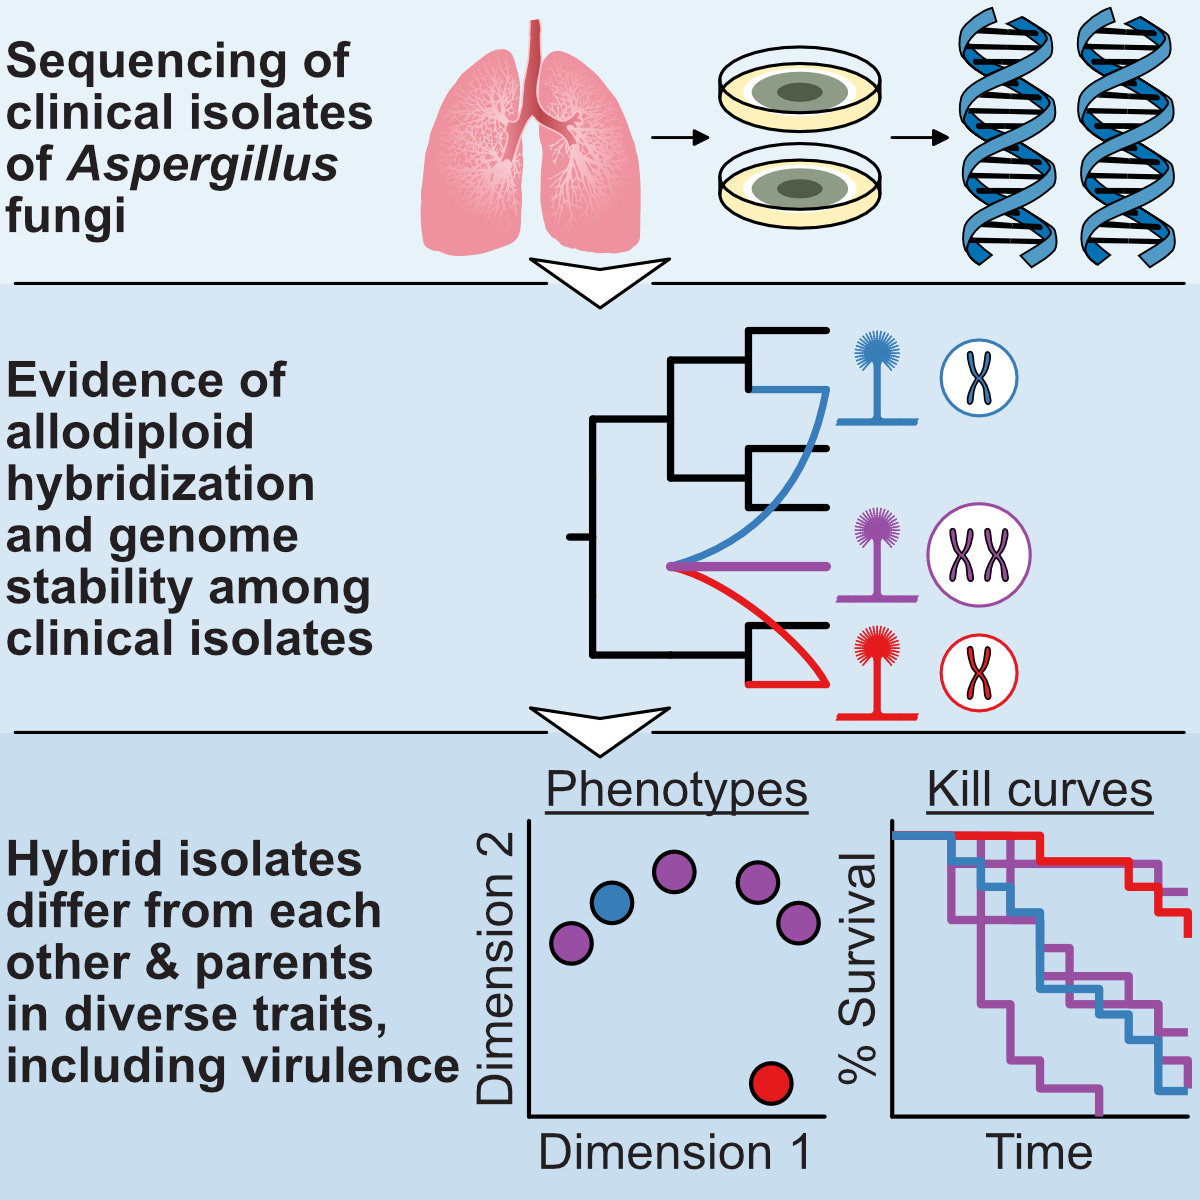
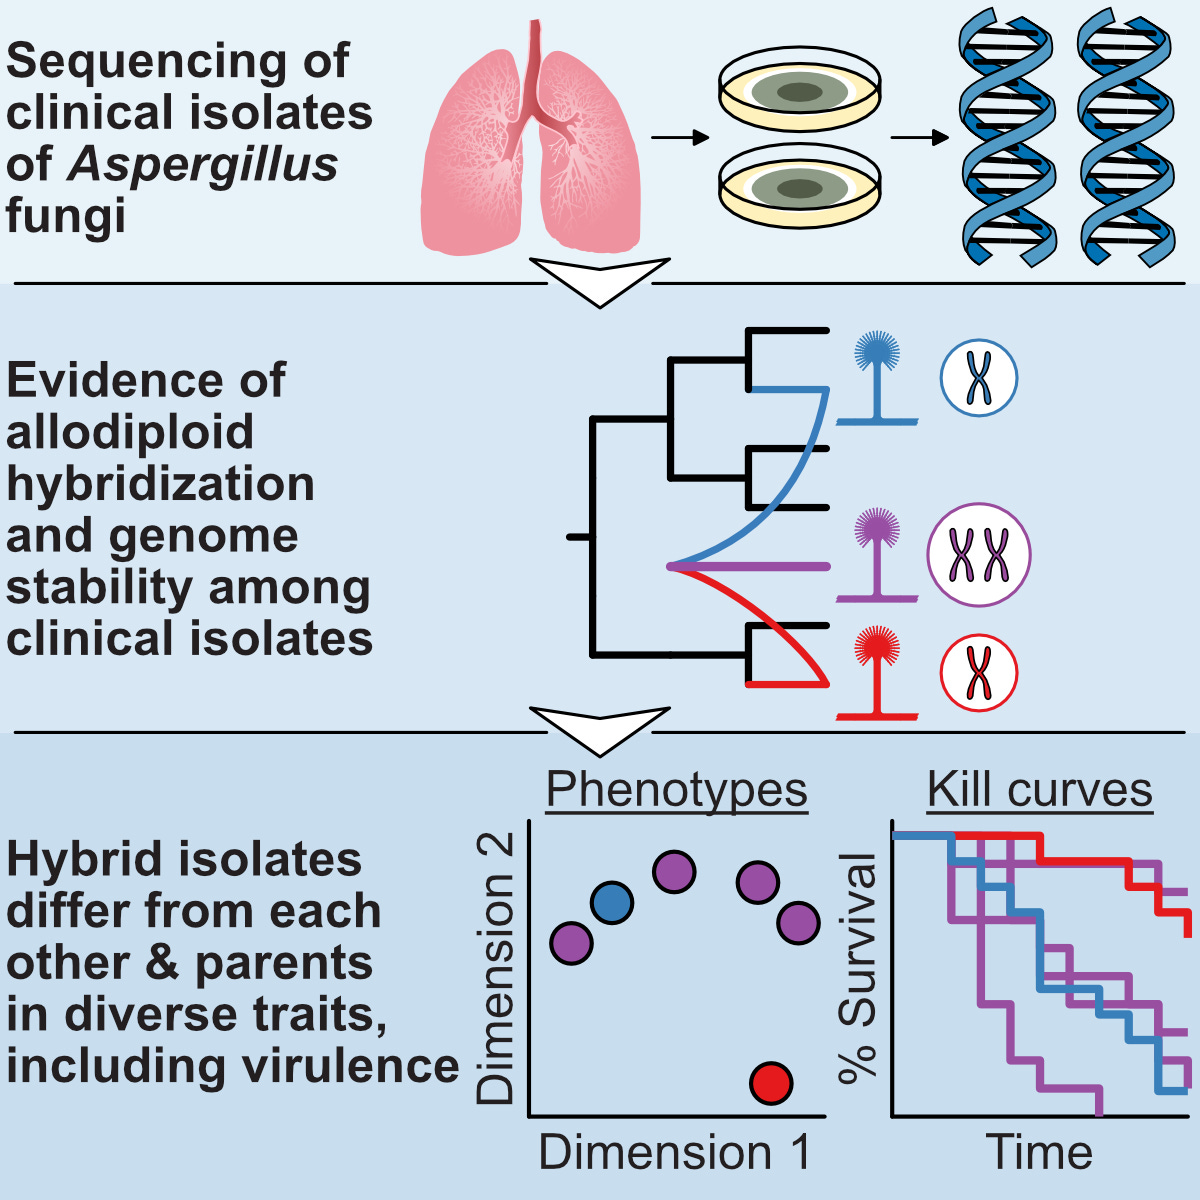
Throughout this article, I will be referring to a graphical abstract I previously made from Steenwyk & Lind et al. (2020) Current Biology. This graphical abstract aimed to highlight three things, each with a dedicated panel
Method: We sequenced clinical isolates of a pathogenic fungus.
Discovery: Newly sequenced isolates were a species that originated from a hybridization event.
Importance: The hybrids were distinct from parental species across clinical-relevant traits, such as growth at the temperature of human bodies and virulence in a model of disease.
Understanding the Purpose of a Graphical Abstract
A graphical abstract is more than a decorative summary. It serves multiple roles:
Attracting Attention and Promoting Share-ability: It captures the interest of readers browsing journal websites or social media.
Summarizing Research: It provides a concise visual summary of your study’s main findings.
Enhancing Comprehension: It aids in the understanding of complex data by offering a visual complement to textual information.
Planning Your Graphical Abstract
1. Identify the Core Message
Begin by pinpointing the key takeaway of your research. Ask yourself the following questions (Note, the answer to each question in the case of Steenwyk & Lind et al. (2020) Current Biology is provided as a sub-bullet point):
What is the central discovery?
We discovered pathogenic fungi that originated from a hybridization event.
How does this work advance the field?
Hybridization contributes to fungal pathogenicity.
What is the simplest way to explain this finding visually?
Three panels, each highlighting a key component of the study.
2. Know Your Audience
Your readership may range from specialists to broadly curious scientists, so your abstract should balance technical precision and accessibility. Generally speaking, I strongly favor accessibility — why limit your audience?
Designing the Graphical Abstract
1. Choose Your Tools
Numerous software options are available for creating graphical abstracts. Popular choices include:
Adobe Illustrator: Offers professional-grade vector graphics capabilities.
BioRender: A user-friendly tool tailored for biological illustrations.
Inkscape: A free, open-source alternative to Illustrator.
PowerPoint or Keynote: Simple yet effective for basic designs.
2. Start with a Sketch
Draft a rough outline on paper or digitally to organize your ideas. Focus on:
The layout: horizontal or vertical flow.
Flow can often be achieved using panels. I would recommend a maximum of three panels. These may, for example, provide an overview of the method and two key findings.
Key elements: objects, arrows, and labels.
Objects can be cartoon representations of key findings.
Arrows can help guide the visual flow.
Composition: central focus with supporting details.
3. Use a Minimalist Approach
Simplicity is key. Avoid clutter and extraneous details by adhering to these principles:
Limit the number of elements.
Use a clean, neutral background.
Focus on essential components: main outcome and larger potential impact.
4. Select a Color Scheme
Colors should guide the viewer’s attention without overwhelming them. Use:
Consistent colors for related elements.
For example, different hues of blue can be used to help create barriers between panels; this is what we did for Steenwyk & Lind et al. (2020) Current Biology.
Contrasting colors for emphasis.
5. Incorporate Visual Hierarchy
Guide the viewer through your abstract with a logical flow:
Start with the most critical element.
Use size, boldness, or color to emphasize key findings.
Include directional arrows or numbering to indicate sequence or causality.
Our top-to-bottom flow in the graphical abstract in Steenwyk & Lind et al. (2020) Current Biology captures key elements of our experimental workflow. This also mirrored the organization of the manuscript.
6. Add Text Sparingly
Text should supplement, not dominate, the graphic. Include:
A concise title or headline.
Brief labels or annotations.
Minimal technical jargon.
Polishing Your Abstract
1. Ensure Accuracy
Scientific precision is non-negotiable. Review:
All labels and annotations for correctness.
Scale bars, if applicable.
Representations of molecular structures, pathways, or other biological entities.
2. Seek Feedback
Share your draft with colleagues to gauge its clarity and appeal. Ask:
Is the key message clear?
Are the visuals easy to interpret?
Does anything seem distracting or unnecessary?
Examples and Inspirations
To refine your approach, you can browse graphical abstracts from recent issues of journals like Cell or Current Biology. Note:
How other authors visually distill complex ideas.
Common design elements and layouts.
Effective use of color, labels, and white space.
While examining other graphical abstracts, you will find a range of approaches have been implemented. Ultimately, each needs to be study-specific, and different studies will warrant different approaches. I would recommend trying to find a study that is similar to yours in design or results but comes from a different field.
Pitfalls to Avoid
Overcrowding: Graphical abstracts benefit from a “less is more” approach.
Overcomplicating the Design: Excessive use of effects or intricate details distracts from the main message.
Neglecting Accessibility: Avoid color combinations that are challenging for colorblind readers.
Creating a graphical abstract is both an art and a science. By following these guidelines, you can design a visual summary that meets the standards of prestigious journals like Current Biology or Cell and amplifies your research's impact. With careful planning, creativity, and attention to detail, your graphical abstract can become a powerful tool for communicating your discoveries to the world.


